Software qGraph & qGraph Viewer

Dedicated to Practical Uses

Compact Software

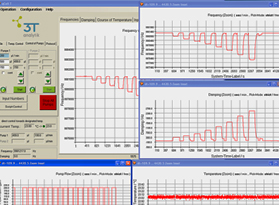
All QCM-D from 3T are equipped with the complete software suite for fully automated instrument control, signal acquisition, real time display, processing and data storage. Individual panels display frequency, damping (dissipation), temperature and pump flow profiles. Online protocol commenting, coordinate display by pick point function, scripts for programming flow rates, patterns and repetitive cycles can be added and edited by the operator. Data export to qGraph Viewer, Excel™, Origin™ and other processing software is supported.

Referencing System

The referencing system offers the opportunity to track off-line/on-line modification of sensors. Once a sensor is registered with its serial number, the initial resonance frequency and damping will be recorded as a reference. Any modification inside or outside QCM-D will be recognized and shown as a difference to the reference.

Calculation of Mass & Thickness

The mass and Thickness can be easily calculated in the software qGraph Viewer. Simply insert the commen physical properties e.g. density into the software, the results will be shown in one click. For viscoelastic layers, there is also advanced module in the software taking damping into consideration.